Unlock Your Website’s Potential: Mastering Google Analytics

Once you have your Google Analytics account up and running, you will start getting a lot of different reports that will help you know which areas of your website need improvement. To an absolute beginner, those reports and pie charts may seem a bit confusing, which is exactly why the rest of this guide will be of immense help.
On this page
Table of Contents
On this page
Table of Contents
By the end of it, you will understand the information your reports will provide you with, as well as what some key metrics are, and you will be able to easily find your way around your Google Analytics dashboard.
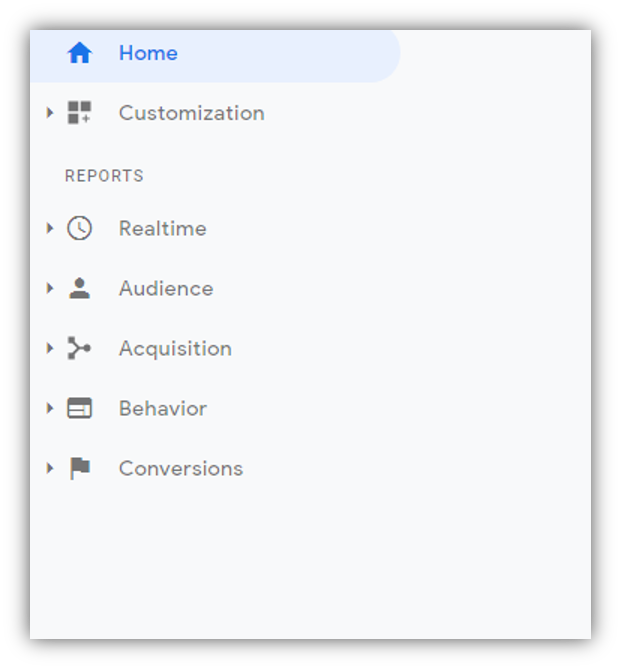
There are four main tabs in your Google Analytics account: Home, Reporting, Customization, and Admin tab. Take a look at what you will find under each of them so that you can better understand your data.
1. Home Tab
On your Home tab, you will be able to take a look at the quick overview of your account. If you have more than one website under your account, you will be shown a list of all of them, so that you can easily choose the one for which you want to see the reports on your website traffic.
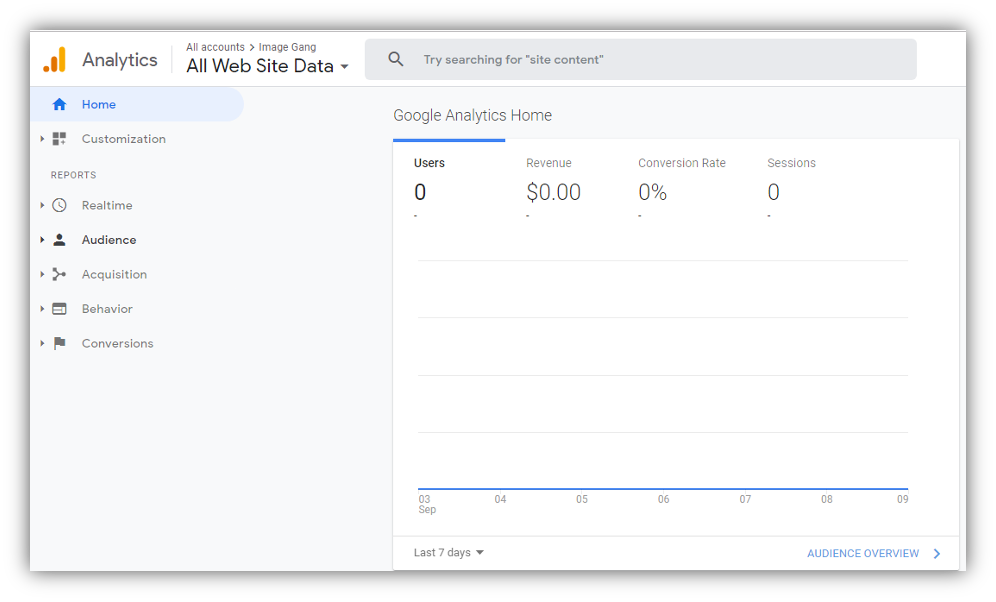
On this tab, you will also be provided with important data regarding your sessions, average session duration, bounce rate and goal conversion rate for each and every one of the websites you may have. Here is a quick overview of what each of those actually mean, as they will be discussed in detail later.
Sessions – The Sessions column shows the sum of all the interactions on your website that occurred within a particular timeframe.
Avg. Session Duration – The Average Session Duration column shows the average duration of all the sessions that took place on your website within a particular timeframe.
Bounce Rate – The Bounce Rate column shows the percentage of users who have left your website at some point, that is, who have “bounced” from your website.
Goal Conversion Rate – The Goal Conversion Rate column shows the sum of the overall conversion rate on your website.
2. Reporting Tab
If you have one website under your account, Google Analytics will take you straight to the Audience Overview report under the Reporting tab every time you log into your account. If you have more than one website, it will take you to the PROPERTY column under the Admin tab, so that you can choose the website for which you want to see the reports, after which you will be taken to your Audience Overview report.
Nevertheless, the Reporting tab in Google Analytics provides you with dashboards and important reports that can give you an insight into how your website is actually performing, so that you can know where and how to make improvements.
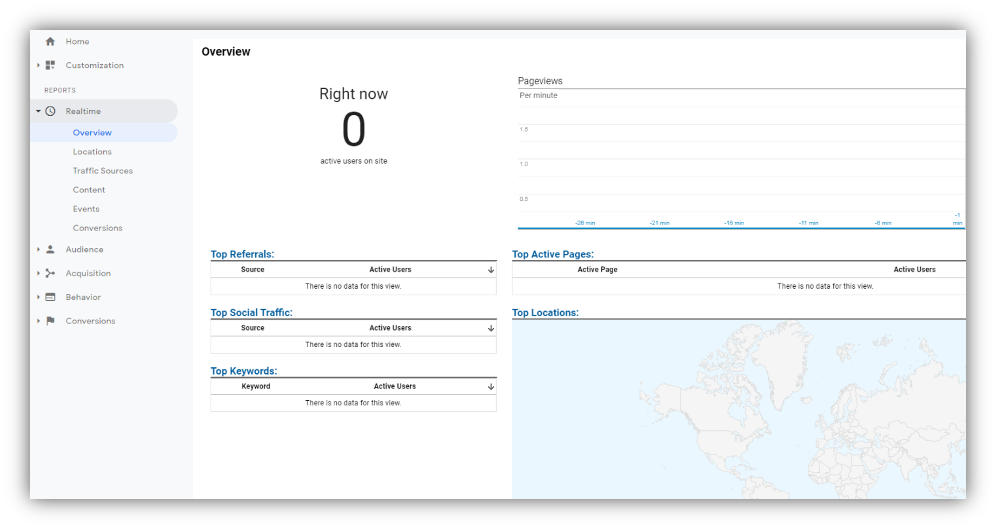
3. Real-Time Reports
Real-Time reports provide you with useful information about the website visitors who are currently on your website. Therefore, as the name suggests, you get reports in real-time. In the Real-Time Overview, you can see the exact number of active users on your website, how many of your website pages are being viewed per minute and per second, the top keywords your active users are using, and a list of your top active pages, along with the number of active users per each of those pages.
Apart from the Overview, you can check the other tabs in Real-Time: Location, Traffic Sources, Content, Events and Conversions in order to take a look at the corresponding data regarding your active users.
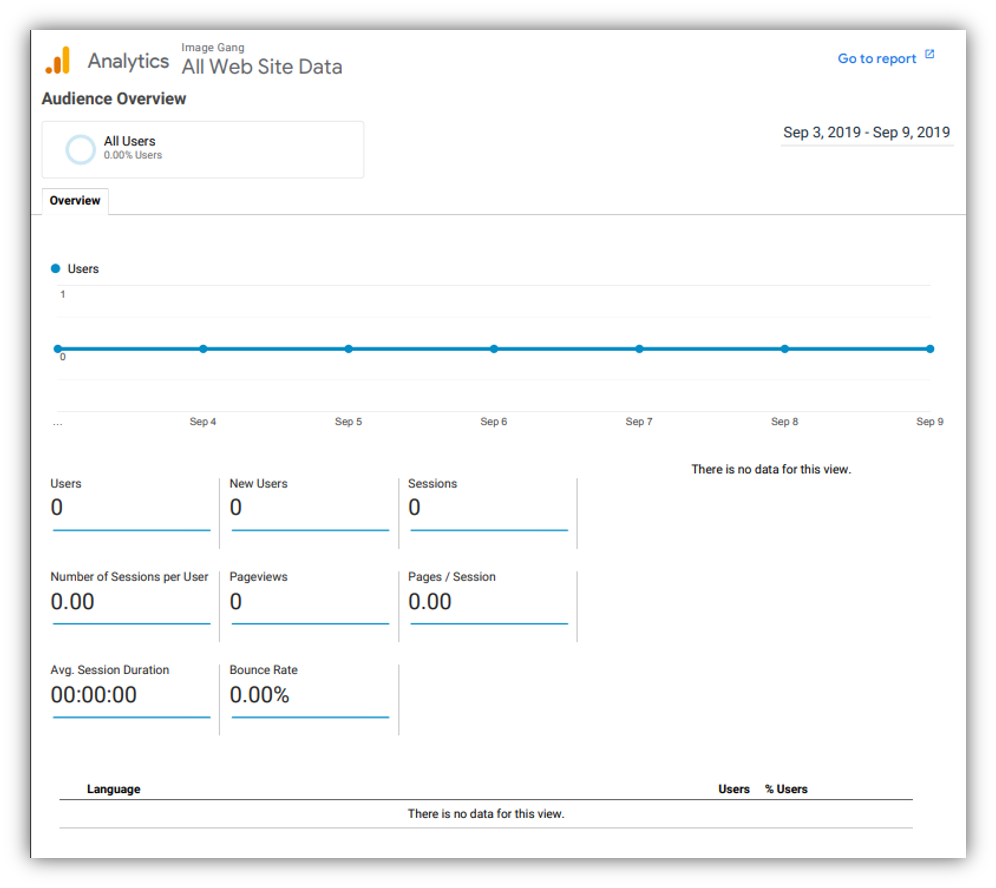
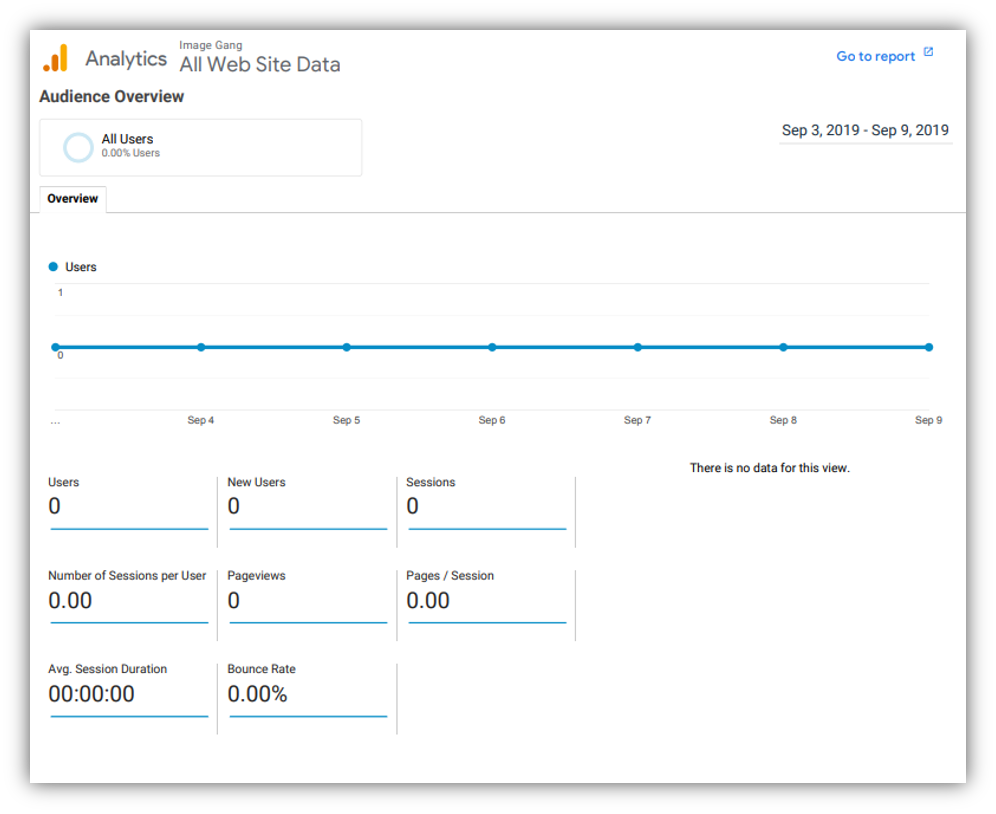
4. Audience Reports
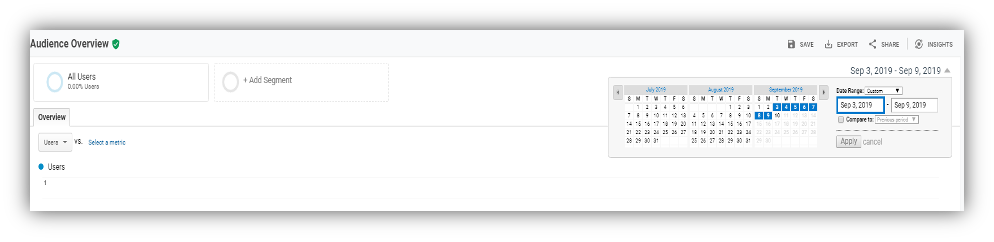
The Audience reports, as the name suggests, provide you with information about your website visitors. In the Audience Overview tab, you can see how many sessions there are on your website over a particular time period. You can choose to see the hourly, daily, weekly and monthly reports.
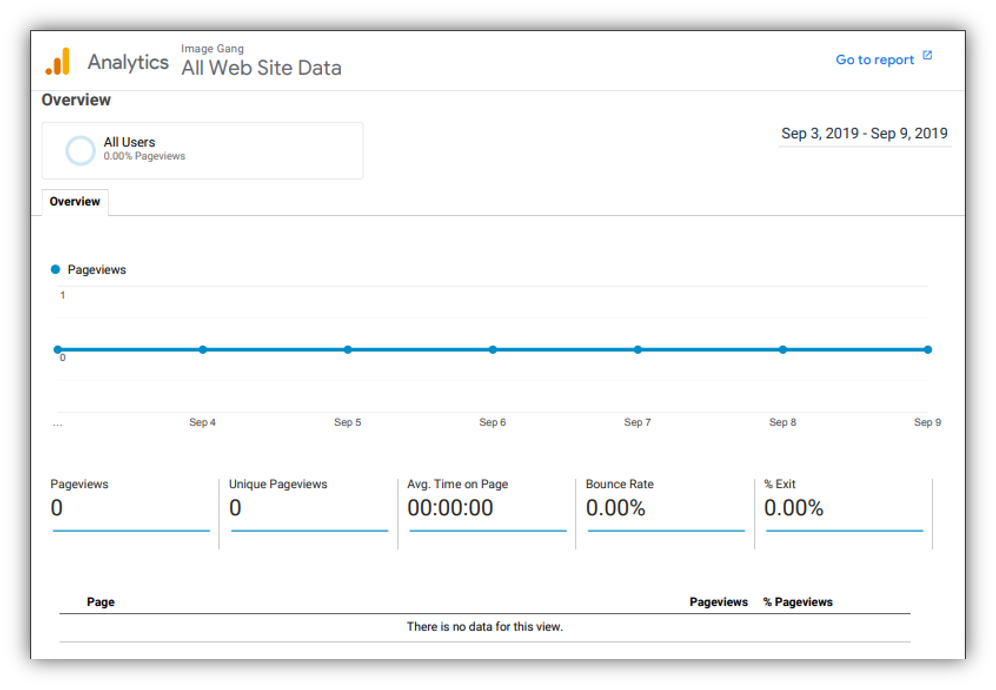
Apart from the Overview tab in Audience reports, you will find a number of other tabs that will provide you with additional information about your website visitors. Those tabs include: Demographics, Interests, Geo, Behavior, Technology, Mobile, Custom, Benchmarking and Users Flow.
The Demographics tab shows you the age and gender of your website visitors. The Interests tab shows you what the interests of your website visitors are, including areas such as technology, movies, travel, news and much more. The Geo tab shows you the locations of your audience and the languages they speak. The Behavior tab shows the behavior of your audience, that is, their interaction with your website (their engagement on your website, whether they are first-time or returning visitors, how often they visit your site).
The Technology and Mobile tabs show you what platform your audience is using when visiting your website (browsers, operating systems, networks, devices). You can use the Custom tab to add custom variables that will help you learn more about your audience over a particular date range.
The Benchmarking tab allows you to compare your date with that of your competition so that you can gain insight into industry trends and target your audience better. However, you can use benchmarking to compare data only with companies that actually share their data. If you use benchmarking, you can choose from three different reports: Channels, Location and Devices.
The Users Flow tab provides you with a graph that shows your audience’s journey through your site, that is, on which page they landed, which pages they viewed and at what point they left your site.
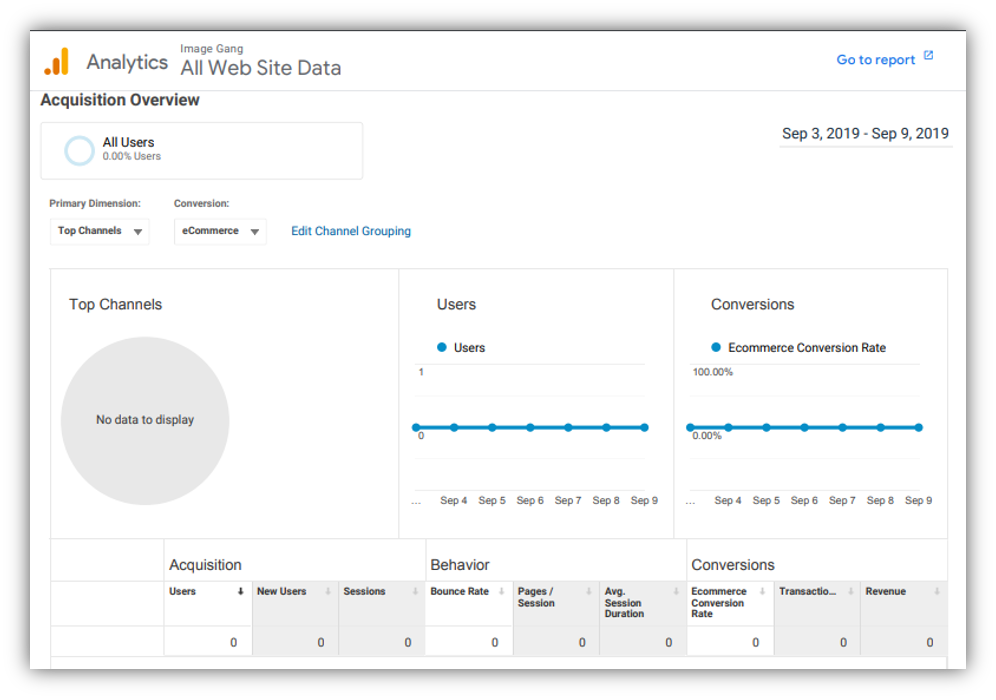
5. Acquisition Reports
The Acquisition reports will show you how your website visitors actually came to your site. It will provide you with an overview of your direct, organic, referral and social (coming from social media) traffic, as well as traffic coming from email. If you use AdWords, you can see how your PPC campaigns are performing. All you need to do is go to the Admin tab and link your AdWords account to your Google Analytics account.
The Search Engine Optimization tab in the Acquisition reports shows you which keywords your website visitors searched for to come to your website. However, in order to use this tab, you need to have a Google Webmaster account and link it to your Google Analytics account.
Comments
0 comments
No comments yet. Be the first to comment.
Related Articles
Jan 8, 2026
Why Google Business Reviews Are Important for Local Business Growth
In today’s digital world, customers trust online reviews more than advertisements.Before visiting a shop or contacting a service, most people first check Google Business reviews. If your business has good reviews, customers trust you faster. That is why Google Business reviews play a very important role in local business growth. ⭐ How Google Business Reviews […]